Red/Blue Map Of United States, 2032
Not long after, Texas will flip blue.
When Red States Turn Blue: An Anticipatory History Of The Next Twenty Years
Hey, so you know how everyon'e always going on about how demographic change will eventually deliver this or that red state to the Democrats? Because minorities keep growing as a share of the electorate, and a number of red states actually have large minority populations, and Republicans keep systematically alienating all of them through an unamenable ideology, not to mention flat-out racism? Well, wouldn't it be interesting to know just which red states are poised to slip into the D column, and when?
Good news! Now we can kinda figure it out. Because AEI, Brookings, and the Center for American Progress recently formed an alliance of cross-ideological wonkery to produce a report called States of Change: The Demographic Evolution of the American Electorate, 1974-2060 (pdf). (CAP has a fantastic interactive graphic here.) It traces changes in the composition of the population, as well as the electorate, along a number of demographic lines - and it does it for every single state. That means we can predict what the composition of the electorate is going to be in any state in the country, for any given year, out to 2060; and with some reasonable estimation as to the Democratic voting rates within each group, we can figure out when this much-ballyhooed demographic change will actually tip some of these states into the Democratic column.
So! Want to know when North Carolina, Arizona, Georgia, and Texas are actually gonna turn blue? Head o'er the fold to find out...
First, here's the methodology. It has four parts:
1) I checked out the CAP interactive graphic to see the projected racial compositions ofeligible voters in each state for the next five presidential election years, 2016 through 2032.
2) I went back to the States of Change report to see how each group had been over- or under-represented in recent elections. I used that information to make predictions about the composition of the actual electorate in each future election.
3) I estimated the vote share for each racial group (whites/blacks/hispanics/others). This was mostly derived from exit polls for elections going back to 2008. There is, admittedly, a little bit of artistry to this stage of the calculation; I had to rely on my gut a little bit to try to figure out just what percentages of each group we should expect Dems to get. I certainly tried to be as fair in my estimations as possible. At any rate, I plugged these numbers into the predicted electorates to get the Dem share of the total vote.
4) I converted this into Dem share of the two-party vote. That is, the percentage of the Democratic + Republican vote that Dems win. So any number over 50.0 means Democrats win; below 50 means they lose.
Now, this probably goes without saying, but I don't mean the numbers I come out with as literal predictions. Think of them as my best estimate of what the vote would look like under generally neutral conditions, where neither candidate has a pronounced advantage in a given state. If it's a good year for Democrats, they might over-perform these numbers; if it's a good Republican year, they might under-perform.
Okay, with that out of the way, here are the red states that have a shot at turning blue in the next five presidential elections...
TEXAS
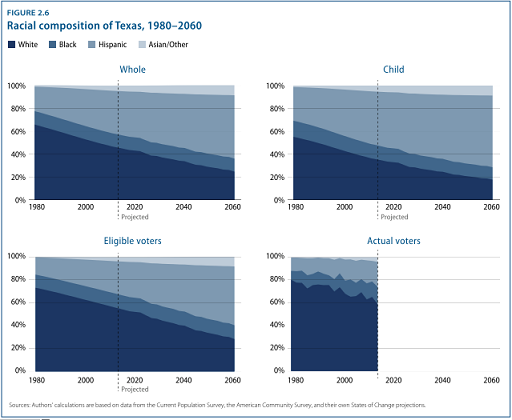
The demographic trends here are unmistakable and inevitable: a shrinking white population and a booming population of hispanics are re-shaping the state, which has already been majority-minority for a decade, and will actually be plurality hispanic by 2020. Thanks to a young skew of the hispanic population and a significant number of non-citizen hispanics, though, the eligible voter population lags. Here are the Anglo/Black/Hispanic/Other percentages of eligible voters, as they are projected for the next few presidential cycles:
2016: 51/12/32/5
2020: 49/12/33/5
2024: 47/12/35/6
2028: 44/12/37/6
2032: 42/12/39/6
2020: 49/12/33/5
2024: 47/12/35/6
2028: 44/12/37/6
2032: 42/12/39/6
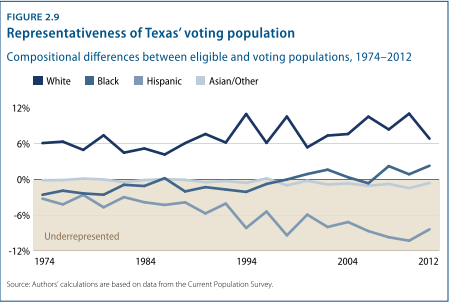
Now in the actual electorate, whites tend to be over-represented relative to eligible voters, and hispanics considerably under-represented, as you see here:
So it might be fair to assume actual electorates that look like this (Whites/blacks/hispanics/others):
2016: 57/13/26/4
2020: 55/13/27/5
2024: 53/13/29/5
2028: 51/13/31/5
2032: 48/13/33/6
2020: 55/13/27/5
2024: 53/13/29/5
2028: 51/13/31/5
2032: 48/13/33/6
Now then. Here are the big assumptions. What persentage of each demographic group are Democrats likely to win? Kerry got 25% of whites in 2004. Obama got 26% in 2008 but maybe only 20-21% in 2012. I think Democrats really don't have much farther to fall with rural whites, and in-migration ought to at least dilute the conservatism of Texas whites a little bit, so I'm going to say we average 23% of the Anglo vote. I'll also assume 93% of blacks, 67% of hispanics, and 60% of others. Once we correct to two-party vote share, that yields the following Dem performances:
2016: 46.0
2020: 46.9
2024: 47.8
2028: 48.6
2032: 49.9
2020: 46.9
2024: 47.8
2028: 48.6
2032: 49.9
If these numbers bear out, Texas would be interesting by 2024, legitimately competitive in 2028, and a pure toss-up by 2032.
Why I might be wrong:
1) I'm really not that confident in my predictions of the Dem share of the white and hispanic votes. One thing is, I'm actually anticipating a little more racial polarization than we've seen to date. For instance, in the notably less-than-great 2014 election, gubernatorial candidate Wendy Davis still cobbled together 25% of the white vote, according to exit polls. Maybe whites will settle in at about 20% Dem, but maybe post-Obama they recover to 25% and drift slowly up from there, due to in-migration, generational change, lower rates of religiosity and higher levels of education. And maybe hispanics don't break out of the mid-60s which has been closer to their ceiling than their average performance in Texas elections.
1) I'm really not that confident in my predictions of the Dem share of the white and hispanic votes. One thing is, I'm actually anticipating a little more racial polarization than we've seen to date. For instance, in the notably less-than-great 2014 election, gubernatorial candidate Wendy Davis still cobbled together 25% of the white vote, according to exit polls. Maybe whites will settle in at about 20% Dem, but maybe post-Obama they recover to 25% and drift slowly up from there, due to in-migration, generational change, lower rates of religiosity and higher levels of education. And maybe hispanics don't break out of the mid-60s which has been closer to their ceiling than their average performance in Texas elections.
2) I assume hispanic (and asian) under-representation continues at the same level it has been. But maybe Battleground Texas is successful! If white over-representation is cut in half, for instance, the state could be close to a toss-up as early as 2024.
So the general picture is: Democrats will definitely benefit from demographic change in Texas, but whether they benefit enough to actually win depends an awful lot on how successful we are in getting our non-voters to vote.
GEORGIA
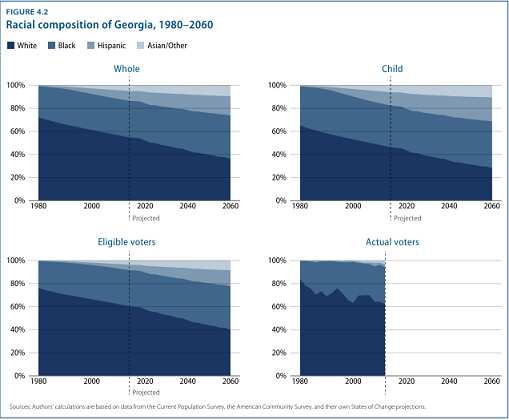
Unlike in Texas, the trend toward an increasingly non-white electorate in Georgia is driven especially by African Americans, who are eligible at higher rates than hispanics, vote at higher rates than hispanics, and are more solidly Democratic as well (though Georgia is also rapidly adding hispanics, for good measure). Here are the white/black/hispanic/other percentages of eligible voters in Georgia, as they are projected for the next few presidential cycles:
2016: 59/31/5/4
2020: 58/32/6/4
2024: 56/32/7/5
2028: 54/33/8/5
2032: 52/34/9/6
2020: 58/32/6/4
2024: 56/32/7/5
2028: 54/33/8/5
2032: 52/34/9/6
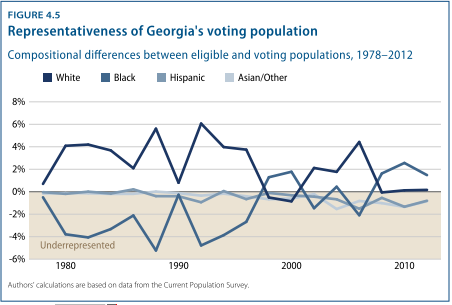
Unlike Texas, minorities haven’t been especially under-represented in Georgia elections; blacks have actually been a bit over-represented recently relative to whites:
This is good, of course, but it does suggest there may be less room to grow simply by getting non-voters to vote. I would expect, in future elections, that whites and blacks would be slightly over-represented, and other groups under-represented, as was the case in 2012. So the presidential electorates may look about like this:
2016: 60/32/5/3
2020: 59/33/5/3
2024: 57/33/6/4
2028: 55/34/7/4
2032: 53/35/8/5
2020: 59/33/5/3
2024: 57/33/6/4
2028: 55/34/7/4
2032: 53/35/8/5
So what percentage of each group will Dems get? Probably slightly lower than Obama’s 95ish% of blacks; I’ll assume 92. And let’s say 65% of both hispanics and others (though I’m open to reasons why that might be too high or too low). What about whites? Well, Kerry got 23% of them in 2004, and Obama got the same 23% in ’08. There wasn't an exit poll for 2012, but reasonable inferences suggest he got about 18-19%. The big question is, where can we expect this number to go in the future? On the one hand, the trend does not look good. On the other hand, Obama was not a candidate positioned to do well with whites in the Deep South – you know, what with the racism and all. Plus, as with Texas, we might expect generational replacement, increasing educational attainment, the increasingly urban (read: Atlanta-centric) character of the population, and in-migration to at least soften the conservatism of the state’s whites. I’ll say Dem performance recovers somewhat, to about 21%. So let’s plug those numbers in and see what we get. Projected Dem vote share of the two-party vote:
2016: 48.0
2020: 48.7
2024: 49.6
2028: 50.8
2032: 52.0
2020: 48.7
2024: 49.6
2028: 50.8
2032: 52.0
There you have it: competitive as early as next year, though more likely by 2020; essentially a toss-up by 2024; and a slight but clear Dem lean by 2030 or so.
Why I might be wrong:
I’m really not that confident in that white vote estimation. Someone playing devil’s advocate might observe that our candidates for Governor and Senate in 2014 each got 23% of whites, if the exit polls are to be believed, and that was not exactly a good year for us. Could 23% be closer to what we could expect going forward? If so then bump our numbers up to:
I’m really not that confident in that white vote estimation. Someone playing devil’s advocate might observe that our candidates for Governor and Senate in 2014 each got 23% of whites, if the exit polls are to be believed, and that was not exactly a good year for us. Could 23% be closer to what we could expect going forward? If so then bump our numbers up to:
2016: 49.2
2020: 49.9 (already a complete toss-up!)
2024: 50.8
2028: 51.9
2032: 53.7
2020: 49.9 (already a complete toss-up!)
2024: 50.8
2028: 51.9
2032: 53.7
On the other hand, maybe the trend downwards for Dems at the federal level has not yet reached its bottom; maybe hispanics and asians don’t enter the electorate as quickly as I’m projecting; maybe black participation subsides somewhat when Obama is out of the Oval Office. In which case, bump these numbers down accordingly.
My gut says Georgia is in play for 2020 (i.e., there will be major expenditures on ads and ground game, etc.), and that we actually win it in ’24 or ’28, depending on the overall political climate in those years.
That’ll be fun!
ARIZONA
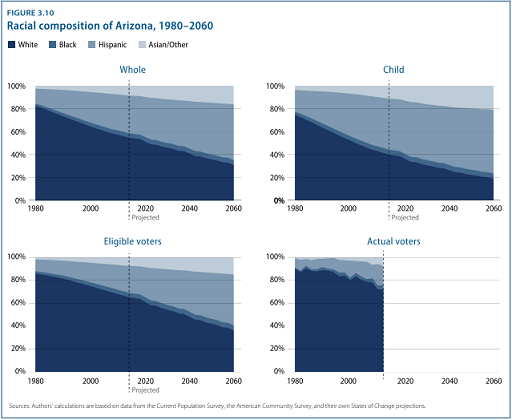
The trend here looks a lot like Texas': hispanic growth is leading the way, while the white share of the population shrinks dramatically - down to only a third of the state, if you go out to the 2050s. Here are the white/black/hispanic/other percentages of eligible voters in Arizona:
2016: 64/4/24/8
2020: 61/4/26/8
2024: 58/4/28/9
2028: 56/4/30/10
2032: 53/4/32/11
2020: 61/4/26/8
2024: 58/4/28/9
2028: 56/4/30/10
2032: 53/4/32/11
Notably, that ‘Other’ category (which is a funny name for a demographic category, by the way) is mostly Native American, and secondarily Asian-American.
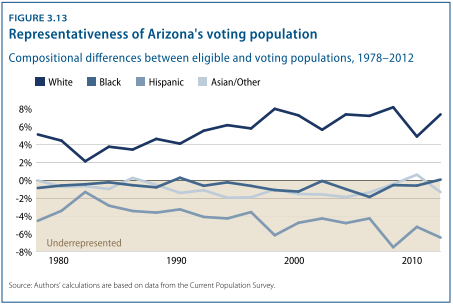
As in Texas, hispanics in Arizona have been substantially under-represented in the electorate. Despite being 23% of eligible voters, they were only 17% of the electorate in 2012, and that’s pretty typical of recent elections. And that has been to the benefit of whites in Arizona, who have been over-represented by a comparable amount. Hopefully this tendency wanes in the years ahead, but I am loathe to predict that it will until we see it actually happening, so I’ll presume a 6% under-representation of hispanics going forward. Meanwhile, according to CAP that “other” category was proportionately represented in the electorate, which surprises me a bit – Native Americans especially tend to have low turnout – but I’ll assume they maintain this rate going forward. (Consider it a hedge against the possibiliity of hispanic participation improving, if you like.) This yields electorates that look like this:
2016: 70/4/18/8
2020: 67/4/20/8
2024: 64/4/22/9
2028: 62/4/24/10
2032: 59/4/26/11
2020: 67/4/20/8
2024: 64/4/22/9
2028: 62/4/24/10
2032: 59/4/26/11
Now let’s give Dems 90% of the black vote. As for the hispanic vote, Obama got 77% of it in 2012, but only 56% in 2008. Of course in ’08 native son McCain was running, and between then and 2012 was the whole SB 1070 collective xenophobic bed-shitting by Arizona’s white-dominated state government, so hispanics in Arizona may genuinely have become substantially more politically polarized. But we should be wary of the recency effect; I’ll pull back from the higher number a little and predict that Dems get 70% of hispanics going forward. Others? I’ll say 80%, given the presence of large numbers of Native Americans, who are very heavily Democratic.
How about whites? Well, Obama got 32% of them in 2012 according to NBC and Fox News, but 36% according to the New York Times. Either number would be way down from Obama’s 40% in ’08 (running against native son McCain, no less), and Kerry’s 41% in ’04. But if the 32% number is right, that would represent an absolute cratering; and yet, the 32% number fits better with Obama’s 44% of the statewide vote. What exactly is going on here? Did Arizona whites suddenly become as polarized as hispanics apparently did? A little bit of this could be attributable to an especially motivated Mormon base coming out for Romney – Mormons are 6% of Arizona’s population, the 5th-highest rate in the country. Also, whites in Arizona (but not the population as a whole, interestingly) are disproportionately old and, for whatever reason, seem to be pretty racist, and this may have hurt Obama in particular; a white nominee may be expected to bounce back a bit. I am going to tentatively anticipate Dems getting 36% of the white vote in Arizona going forward.
So all right. Here’s the Dem share of the two-party vote that gets us:
2016: 48.7 (wow – already within 3%!)
2020: 49.5
2024: 50.6
2028: 51.6
2032: 52.8
2020: 49.5
2024: 50.6
2028: 51.6
2032: 52.8
Just the slightest R tilt in 2020, and then an increasing Dem lean after that. But given the particularly wide error bars on this prediction, I wouldn’t be surprised if Arizona were fully in play next year – or if it didn’t become a true battleground until 2024 or even 2028. But the demographic change here is steep, and it really is only a matter of time before it alters the electoral landscape of the state.
Why I might be wrong:
God, what might I not be wrong about on this one? I mean, there's the Dem share of the white vote - maybe it really will settle in at 32%. (But it can't, right? I mean, we're talking about the 8th-most urban state in the country, and it's outside the south; a state like that has to have a higher share of Dems among whites, doesn't it?) Or maybe it will bounce back to 40% (but if it does that then we ought to win it next year, which would be a pretty enormous swing from 2012, almost an implausible one). And our Senate candidate did get 40% of whites in 2012, and lost by only 3%... Meanwhile, will hispanic participation remain low or increase? Will they support Dems at the elevated rates of 2012 or regress to the mean? Will "others" vote at a proportional rate or is that too optimistic? Will generational replacement accelerate the Dem trend, or will a flood of white seniors flock to the state to bask in the reflected glory of American Patriot Joe Arpaio?
God, what might I not be wrong about on this one? I mean, there's the Dem share of the white vote - maybe it really will settle in at 32%. (But it can't, right? I mean, we're talking about the 8th-most urban state in the country, and it's outside the south; a state like that has to have a higher share of Dems among whites, doesn't it?) Or maybe it will bounce back to 40% (but if it does that then we ought to win it next year, which would be a pretty enormous swing from 2012, almost an implausible one). And our Senate candidate did get 40% of whites in 2012, and lost by only 3%... Meanwhile, will hispanic participation remain low or increase? Will they support Dems at the elevated rates of 2012 or regress to the mean? Will "others" vote at a proportional rate or is that too optimistic? Will generational replacement accelerate the Dem trend, or will a flood of white seniors flock to the state to bask in the reflected glory of American Patriot Joe Arpaio?
Arizona is weird. My gut says we could win it in a decent year for us by 2020. But this is a case where my gut is feeling pretty unsure of itself.
NORTH CAROLINA
I mean, North Carolina kinda already did turn blue – in 2008, when Obama and Hagan won. And then it was Obama’s narrowest loss in 2012, even though it trended slightly Dem (which is especially impressive considering we went from a situation in 2008 where Obama wildly outspent/out-organized McCain in the state, to a situation in 2012 where Romney spent considerably more than Obama; that it still trended Dem despite that goes to show the potency of the blue trend in NC). But it does still have a Republican lean relative to the country as a whole, and Romney won it, and by that definition it's still a red state. So where is it headed?
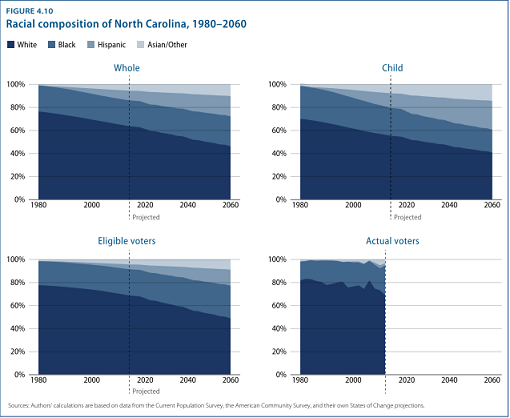
Eligible voters, projected by white/black/hispanic/other shares:
2016: 68/23/5/4
2020: 66/23/5/5
2024: 65/24/6/5
2028: 63/24/7/6
2032: 61/25/8/6
2020: 66/23/5/5
2024: 65/24/6/5
2028: 63/24/7/6
2032: 61/25/8/6
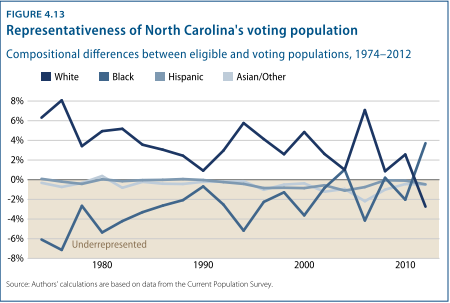
White over-representation and black under-representation have both been on the decline; blacks actually outvoted whites in 2012. Going forward I’ll expect slight over-representation by both groups (a point each), and slight under-representation by others (ditto). So:
2016: 69/24/4/3
2020: 67/24/4/4
2024: 66/25/5/4
2028: 64/25/6/5
2032: 62/26/7/5
2020: 67/24/4/4
2024: 66/25/5/4
2028: 64/25/6/5
2032: 62/26/7/5
For blacks I’ll predict a 92% Dem share. Hispanics and others are so small that they don’t show up in exit polls, so I will just make an educated guess and treat them as collectively giving Dems 67%.
Now with whites I’m going to do something I didn’t do with the other states – I’m going to project that the Dem share improves over time. Here’s the reason: in Texas, Georgia, and Arizona, young whites don’t vote significantly more Dem than older whites. In North Carolina it’s a very different picture. Now, the 2012 exit polls didn’t do an “Age by Race” category that lets us look at these numbers, but the 2008 exit polls did, and it found 18-29 year old whites in NC went 56-44 Obama, whereas every older group was around 67-32 McCain. That’s a 24-point gap in Obama performance. For the nation as a whole in 2008, the gap was only 13 points. Basically older whites in NC voted like they were from Tennessee and young whites voted like they were from Pennsylvania or New Jersey. (This helps explain why under-40 voters in NC in 2012 gave a similar margin to Obama as under-40 voters in states like Washington or Connecticut.) These under-30 voters began to age into their 30s in 2012, and sure enough, Obama went from basically tying McCain for 30-somethings to winning them by 17% against Romney, even as he did worse in the state overall. Those exit poll numbers may be a little exaggerated, but it’s hard to deny the trend at least.
So basically, whites born after 1978 or so vote as if they’re from a northern, moderate-to-liberal state. By 2016, according to the back of the proverbial envelope, those whites will make up about 27% of the total white vote. By 2024, they’ll be up to 41ish%. And by 2032, 55% or so.
So here’s what I’m doing. I’m predicting that the white vote grows more Democratic in proportion to the share of the electorate made up by those born after 1978, and in proportion to the 11% by which the young white/old white difference in North Carolina exceeds that difference for the US as a whole.
Good lord. That sounds horrible. Sorry if that’s not clear. The long and short of it is: I anticipate Dems will gain about 1% among whites per election cycle.
But what base to start from? Well, Obama got 35% of whites in ’08, and 31% in ’12. Hagan got 33% in 2014. That seems like a reasonably conservative estimation for 2016 (and implies 34% for 2020, 35% for 2024, etc.).
And so we get the following Democratic percentages of the two-party vote…
2016: 50.4 (almost exactly what Obama got in 2008, as it happens)
2020: 51.6
2024: 53.0
2028: 54.3
2032: 55.8
2020: 51.6
2024: 53.0
2028: 54.3
2032: 55.8
So if you’re scoring at home, that’s the barest Dem tilt in 2016, a Dem lean in 2020, and it gets better from there.
Why I might be wrong:
Eh. I feel pretty good about this one. I mean, I guess a meteor could strike the Research Triangle…
Eh. I feel pretty good about this one. I mean, I guess a meteor could strike the Research Triangle…
All right, I suppose white support for Dems could drop a bit, or at least fail to rise, as Dems do still draw some support from rural whites, especially in Appalachia, and that support may have further to fall. And black participation rates could retreat a bit. But at worst I would see these as partially mitigating the Dem trend, rather than reversing it.
OTHER STATES
Beyond these four, the pickings get pretty slim. Alaska is somewhat interesting. The eligible voter population should go fom 69% white in 2012 to 53% in 2032. "Others" (mainly native Alaskans) will go from 23 to 36% (and 52% by 2060, for what it's worth). Now I don't really have a grasp on how either whites or natives in Alaska can be expected to vote, so I won't even try to project it. But it's not crazy to imagine the white vote becoming more moderate if a decent number of people from the West Coast move up there, and that combined with the change in the racial composition of the state might make it competitive. Nate Silver is at leastintrigued.
Mississippi sometimes gets bandied about as a red-->blue state - people see that it's 37% black and has a white share of the population that's shrinking and wonder how a state like that isn't competitive. Here's how: Obama won 10% of whites in 2012, and 11% in 2008. Our conservadem nominee for senate last year got up to 16%, and we still lost that race by 20 points. It's just too racially polarized to be winnable. I mean, look: eligible voters in 2040 will be 56% white, 38% black, and 7% others. Even if Democrats win 15% of whites, 93% of blacks, and 80% of others, and minorities are not under-represented in the electorate, the Dem will win 49% of the vote. So under some generous assumptions, the state becomes close - by 2040. Are you gonna hold your breath for that?
Louisiana is in a similar way, but perhaps a bit more promising. It's projected to be a majority-minority state by 2039, but in 2032 eligible voters will still be 56% white, 34% black, and 10% others. Whites are a tad less conservative here than in Mississippi - and more heterogeneous, given the Cajun and larger urban populations - and while Obama only got 14% in 2008, white Democratic candidates can make it into the low-20s. So if the electorate in 2032 is 57/35/8, and our candidate can get 21% of the white vote or so, then the state becomes a toss-up. It's certainly plausible (and the emergence of New Orleans as a creative class mecca should help), but I will wait for the 2016 exit polls before predicting that we're able to bounce back that much at the presidential level. If nothing else, it will be worth finding good candidates to run for Senate and Governor.
Montana and the Dakotas are worth keeping an eye on. Those states have proven themselves willing to elect Democrats to the House and Senate, and Democrats actually do respectably among whites in these states, which is impressive, considering they're all among the ten most rural states in the country. It's just that they're so overwhelmingly white that they remain out of reach at the presidential level. That overwhelming whiteness is expected to change, though, based especially on rapid growth of the Native American population in each state; the non-white population is projected to get above 20% in all three states by 2032. So you know. We'll see.
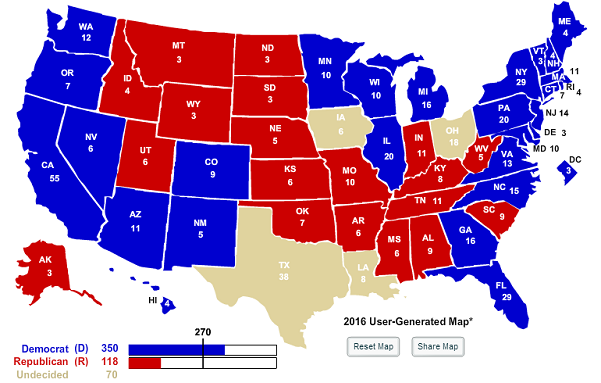
And that's really it. Every other red state looks like it will stay that way until there's some sort of significant partisan realignment. (South Carolina? Are you wondering about South Carolina? Well, don't; it's white population actually grew faster than its black population in the 2000s, the only state in the lower-48 for which that is true. Its prospects are not great.) Which, I mean, that's fine, really - I won't complain if the 2032 electoral map looks like this:
But here's the thing. I don't actually think it will look like this. Or if it does, it won't continue to look like this in 2040. Because it would just be unsustainable for the Republican Party to do so poorly in presidential elections. Eventually they'll have to adapt and compete with Democrats for some of the same voters, rather than depend on their old/white/dying base. In other words, they're going to have to moderate. And that's the real good news in all this - because it means American politics is poised to turn to the left. Maybe Republicans adapt by appealing to more people of color, or maybe they become more competitive with moderate whites. Either way, our politics will be better off, and our country will be, too.
You know, unless American democracy collapses in the mean time.
No comments:
Post a Comment