Mandatory Voting Worldwide
Mandatory Voting Would Focus Candidates On All Citizens,
Not Just Their Rabid Base
What the 2012 election could have looked like with 100 percent turnout
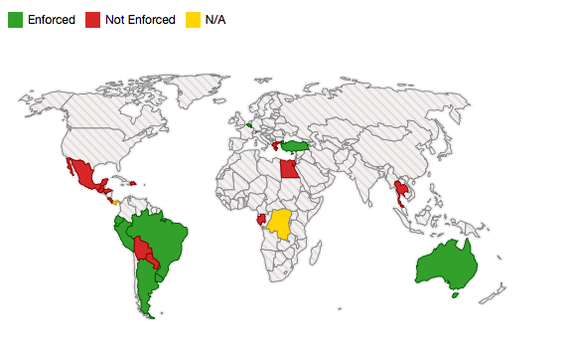
At an event in Cleveland on Wednesday, President Obama endorsed a system of mandatory voting, a policy that would penalize eligible voters who don't make it to the polls on Election Day. The idea is not universally embraced, though it has significantly boosted turnout in Australia, where it's in place.
It's very easy to see why Obama likes the idea. He spoke longingly of increased turnout during the 50th anniversary ceremony in Selma, Ala., earlier this month. There's value in getting more people involved in the democratic process that doesn't tie directly to the success of his party, but it's clear that that's a motivation. During last year's election — an election in which non-white voters comprised only 25 percent of the vote, according to exit poll data — Obama's party was routed. Increasing turnout would almost certainly have helped.
We can actually run a thought experiment that looks at an alternate 2012 universe in which voting was mandatory. If every citizen of voting age had come out to vote during Obama's reelection race, the results would have been the same (that is, he would have won), but the electoral map would have looked much different.
The Census Bureau has historic data broken down by state, race and gender, which we can compare to exit poll data. We don't have access to every state's data, which is a very big caveat, but we can still see what the election might have looked like.
Here's the actual result.

Here's how the electoral map would have looked if every voting-age person voted and we apply exit poll data by race.

And the same, if we apply exit poll data by gender.

Why the huge difference? A few reasons. First of all, notice that Indiana is dark red on that gender-based map. That's because we have data from Indiana specifically, which we don't for other, more Republican states. It's also more heavily white than many other places. This thought experiment doesn't differentiate between men and women within racial groups, which can vary widely; it's a rough calculation.
But black and Hispanic voters often turn out less heavily than white voters, and more heavily favored Democrats in 2012. Adjusting those numbers upward has a big effect. Obama clearly understands that such a boost could pay benefits in future elections, too.
State-by-state results
This table shows the net vote margin for Obama and Romney based on 100 percent turnout. States for which exit poll data was used are marked with an asterisk.
| State | Result based on gender data | Result based on race data |
|---|---|---|
| Alabama | Obama 85,980 (2.5%) | Obama 306,610 (8.8%) |
| Alaska | Obama 8,730 (1.8%) | Romney 35,300 (7.1%) |
| Arizona* | Romney 210,060 (4.9%) | Obama 9,080 (0.2%) |
| Arkansas | Obama 50,910 (2.4%) | Romney 19,340 (0.9%) |
| California* | Obama 4,864,340 (20.8%) | Obama 5,722,270 (24.4%) |
| Colorado* | Obama 140,790 (4%) | Obama 113,300 (3.2%) |
| Connecticut* | Obama 401,490 (16.1%) | Obama 428,690 (17.2%) |
| Delaware | Obama 16,150 (2.5%) | Obama 40,860 (6.4%) |
| District Of Columbia | Obama 12,550 (2.7%) | Obama 176,220 (38.2%) |
| Florida* | Obama 107,840 (0.8%) | Obama 774,350 (5.8%) |
| Georgia | Obama 164,100 (2.4%) | Obama 1,158,590 (17.2%) |
| Hawaii | Obama 18,960 (2%) | Obama 185,290 (19.9%) |
| Idaho | Obama 23,620 (2.2%) | Romney 150,510 (14.1%) |
| Illinois | Obama 207,600 (2.4%) | Obama 348,800 (3.9%) |
| Indiana* | Romney 481,110 (10.2%) | Romney 535,570 (11.3%) |
| Iowa* | Obama 120,560 (5.4%) | Obama 175,420 (7.9%) |
| Kansas | Obama 45,490 (2.3%) | Romney 180,550 (9.2%) |
| Kentucky | Obama 75,760 (2.4%) | Romney 355,300 (11.1%) |
| Louisiana | Obama 87,370 (2.7%) | Obama 483,940 (14.9%) |
| Maine | Obama 22,020 (2.2%) | Romney 183,300 (18%) |
| Maryland | Obama 96,250 (2.4%) | Obama 653,450 (16.3%) |
| Massachusetts* | Obama 1,055,030 (22.1%) | Obama 1,102,100 (23.1%) |
| Michigan | Obama 172,530 (2.4%) | Romney 133,240 (1.8%) |
| Minnesota | Obama 83,440 (2.1%) | Romney 477,940 (12.2%) |
| Mississippi | Obama 55,200 (2.6%) | Obama 395,470 (18.6%) |
| Missouri* | Romney 416,140 (9.4%) | Romney 760,280 (17.2%) |
| Montana | Obama 15,550 (2.1%) | Romney 129,890 (17.2%) |
| Nebraska | Obama 27,540 (2.1%) | Romney 152,850 (11.8%) |
| Nevada* | Obama 134,580 (7.4%) | Obama 52,440 (2.9%) |
| New Hampshire* | Obama 62,160 (6.3%) | Obama 60,870 (6.1%) |
| New Jersey* | Obama 1,087,560 (18.3%) | Obama 729,410 (12.3%) |
| New Mexico | Obama 33,740 (2.4%) | Obama 152,290 (10.7%) |
| New York* | Obama 3,415,350 (26.1%) | Obama 3,260,670 (24.9%) |
| North Carolina* | Romney 209,510 (3.1%) | Romney 301,960 (4.5%) |
| North Dakota | Obama 10,460 (2%) | Romney 80,300 (15.6%) |
| Ohio* | Obama 207,180 (2.4%) | Romney 166,660 (1.9%) |
| Oklahoma | Obama 63,210 (2.3%) | Romney 144,580 (5.3%) |
| Oregon | Obama 60,800 (2.2%) | Romney 358,090 (12.8%) |
| Pennsylvania* | Obama 503,510 (5.3%) | Romney 107,860 (1.1%) |
| Rhode Island | Obama 19,250 (2.6%) | Romney 55,160 (7.3%) |
| South Carolina | Obama 87,510 (2.6%) | Obama 350,560 (10.4%) |
| South Dakota | Obama 12,770 (2.1%) | Romney 94,300 (15.5%) |
| Tennessee | Obama 118,040 (2.5%) | Romney 49,280 (1.1%) |
| Texas | Obama 377,510 (2.4%) | Obama 2,703,410 (16.8%) |
| Utah | Obama 40,810 (2.3%) | Romney 206,290 (11.5%) |
| Vermont | Obama 10,800 (2.2%) | Romney 83,740 (17.2%) |
| Virginia* | Obama 163,900 (2.9%) | Obama 58,940 (1%) |
| Washington | Obama 110,790 (2.3%) | Romney 383,910 (7.9%) |
| West Virginia | Obama 32,620 (2.3%) | Romney 234,230 (16.2%) |
| Wisconsin* | Obama 202,250 (4.8%) | Obama 171,530 (4%) |
| Wyoming | Obama 8,580 (2%) | Romney 59,100 (14.1%) |

Philip Bump writes about politics for The Fix. He is based in New York City.
No comments:
Post a Comment